
File:Torus illustration.png
Size of this preview: 640 × 422 pixels.
| |
This is a file from the Wikimedia Commons. Information from its description page there is shown below.
Commons is a freely licensed media file repository. You can help. |
|
|
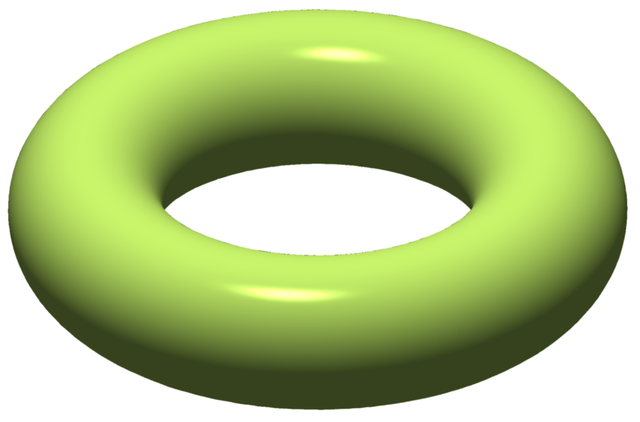
This chart was created with MATLAB. |
| Description | Illustration of torus |
| Date | 01:12, 13 July 2008 (UTC) |
| Source | self-made, with MATLAB |
| Author | Oleg Alexandrov |
 |
I, the copyright holder of this work, release this work into the public domain. This applies worldwide. In some countries this may not be legally possible; if so: I grant anyone the right to use this work for any purpose, without any conditions, unless such conditions are required by law.
|
 |
This math image could be recreated using vector graphics as an SVG file. This has several advantages; see Commons:Media for cleanup for more information. If an SVG form of this image is already available, please upload it. After uploading an SVG, replace this template with {{ vector version available|new image name.svg}}. |
Source code
% illustration of a torus, obtained as an isosurface
function main()

   % big and small radii of the torus
   R = 3; r = 1;

   Kb = R+r;

   h = 0.1; % h is the grid size. Smaller h means prettier picture.

   X = (-Kb-h):h:(Kb+h);   m = length(X);
   Y = (-Kb-h):h:(Kb+h);   n = length(Y);
   Z = (-r-h):h:(r+h);     k = length(Z);

   W = zeros(m, n, k); % the zero level set of this function will be the desired shape

   for i=1:m
      for j=1:n
         x = X(i);
         y = Y(j);
         W(i, j, :) = (sqrt(x^2+y^2)-R)^2 + Z.^2-r^2; % torus eqn, vectorize in Z
      end
   end

   figure(4); clf; hold on; axis equal; axis off;

   H = patch(isosurface(W, 0));
   isonormals(W, H);

   light_green=[184, 224, 98]/256;

   % set some propeties
   set(H, 'FaceColor', light_green, 'EdgeColor','none', 'FaceAlpha', 1);
   set(H, 'SpecularColorReflectance', 0.1, 'DiffuseStrength', 0.8);
   set(H, 'FaceLighting', 'phong', 'AmbientStrength', 0.3);
   set(H, 'SpecularExponent', 108);

   daspect([1 1 1]);
   axis tight;
   colormap(prism(28))

  % viewing angle
   view(-146, 32);

  % add in a source of light
   camlight (-10, 54); lighting phong;

  %save as png
  print('-dpng', '-r400', sprintf('Torus_illustration.png'));
File usage
The following pages on Schools Wikipedia link to this image (list may be incomplete):
Did you know...?
Through Schools Wikipedia, SOS Children's Villages has brought learning to children around the world. SOS Children believes that a decent childhood is essential to a happy, healthy. Our community work brings families new opportunities through education, healthcare and all manner of support. Have you thought about sponsoring a child?