
File:Complex numbers conjugation.png
- File
- File usage
- Did you know...?
| |
This is a file from the Wikimedia Commons. Information from its description page there is shown below.
Commons is a freely licensed media file repository. You can help. |
La bildo estas kopiita de wikipedia:en. La originala priskribo estas:
Contents |
Summary
Made by myself with matlab.
 |
File:Complex numbers conjugation.svg is a vector version of this file. It should be used in place of this raster image when superior. File:Complex numbers conjugation.png
For more information about vector graphics, read about Commons transition to SVG.
|
 |
Licensing
 |
This work has been released into the public domain by its author, Oleg Alexandrov at the English Wikipedia project. This applies worldwide. In case this is not legally possible: |
Source code
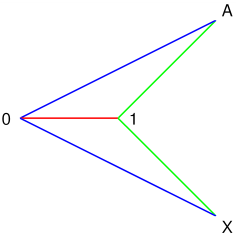
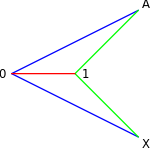
function main ()

% set up the plotting window
thickness=2.8; fs=30; d=0.005;
red=[1, 0, 0]; green=[0, 1, 0]; blue=[0, 0, 1];
figure(1); clf; hold on; axis equal; axis off;
i=sqrt(-1);

z1=0; z2=1; z3=2+i;
plot_seg(z1, z2, red, thickness);
plot_seg(z2, z3, green, thickness);
plot_seg(z3, z1, blue, thickness);

pt (z1, fs, 4, d, '0');
pt (z2, fs, 0, d, '1');
pt (z3, fs, 1, d, 'A');

z1=0; z2=1; z3=2-i;
plot_seg(z1, z2, red, thickness);
plot_seg(z2, z3, green, thickness);
plot_seg(z3, z1, blue, thickness);

pt (z3, fs, 7, d, 'X');

saveas(gcf, 'Complex_numbers_conjugation.eps', 'psc2')

% convert from eps to png with the shell command
% convert -antialias -density 400 -scale 20% Complex_numbers_conjugation.eps Complex_numbers_conjugation.png


function plot_seg(z1, z2, color, thickness);
  plot( [real(z1), real(z2)], [imag(z1), imag(z2)], 'color', colour, 'linewidth', thickness );

function pt (z, fs, pos, d, tx)
 p=cos(pi/4)+sqrt(-1)*sin(pi/4);
 z = z + p^pos * d * fs;
 shiftx=0.0003;
 shifty=0.002;
 x = real (z); y=imag(z);
 H=text(x+shiftx*fs, y+shifty*fs, tx); set(H, 'fontsize', fs, 'HorizontalAlignment', 'c', 'VerticalAlignment', 'c')
| date/time | username | edit summary |
|---|---|---|
| 04:59, 24 October 2005 | en:User:Oleg Alexandrov | (fix bug) |
| 04:58, 24 October 2005 | en:User:Oleg Alexandrov | (source code) |
| 03:45, 24 October 2005 | en:User:Oleg Alexandrov | (Made by myself with matlab.) |
Historio de la dosiero
Legend: (cur) = this is the current file, (del) = delete this old version, (rev) = revert to this old version.
Click on date to download the file or see the image uploaded on that date.
- (del) (cur) 03:45, 24 October 2005 . . en:User:Oleg_Alexandrov Oleg Alexandrov ( en:User_talk:Oleg_Alexandrov Talk) . . 236x238 (4756 bytes) (Made by myself with matlab. )
Did you know...?
Schools Wikipedia has made the best of Wikipedia available to students. SOS Childrens Villages cares for children who have lost their parents. Our Children's Villages give these children a new home and a new family, while a high-quality education and the best of medical care ensures they will grow up with all they need to succeed in adult life. Help another child by taking out a sponsorship.